Monitoring
The Monitoring page of a project shows the health, traffic and errors of the project’s apps and data service, and the memory of its servers. It is in the project sidebar, under Monitoring.
Monitoring is the same for Buildpad Engine projects and Supabase projects.
Who Can See It
Every member of the organization who can open the project can see its Monitoring page. A restricted project shows its Monitoring page only to the people who can open the project.
The Time Range
At the top right of the page, select 6 hours, 24 hours or 7 days. All charts, the uptime strips, the incidents and the errors use the range that you select. While the page is open and its browser tab is visible, it gets new data every minute. To get new data at once, click Refresh.
What the Page Shows
The page has these sections, from top to bottom.
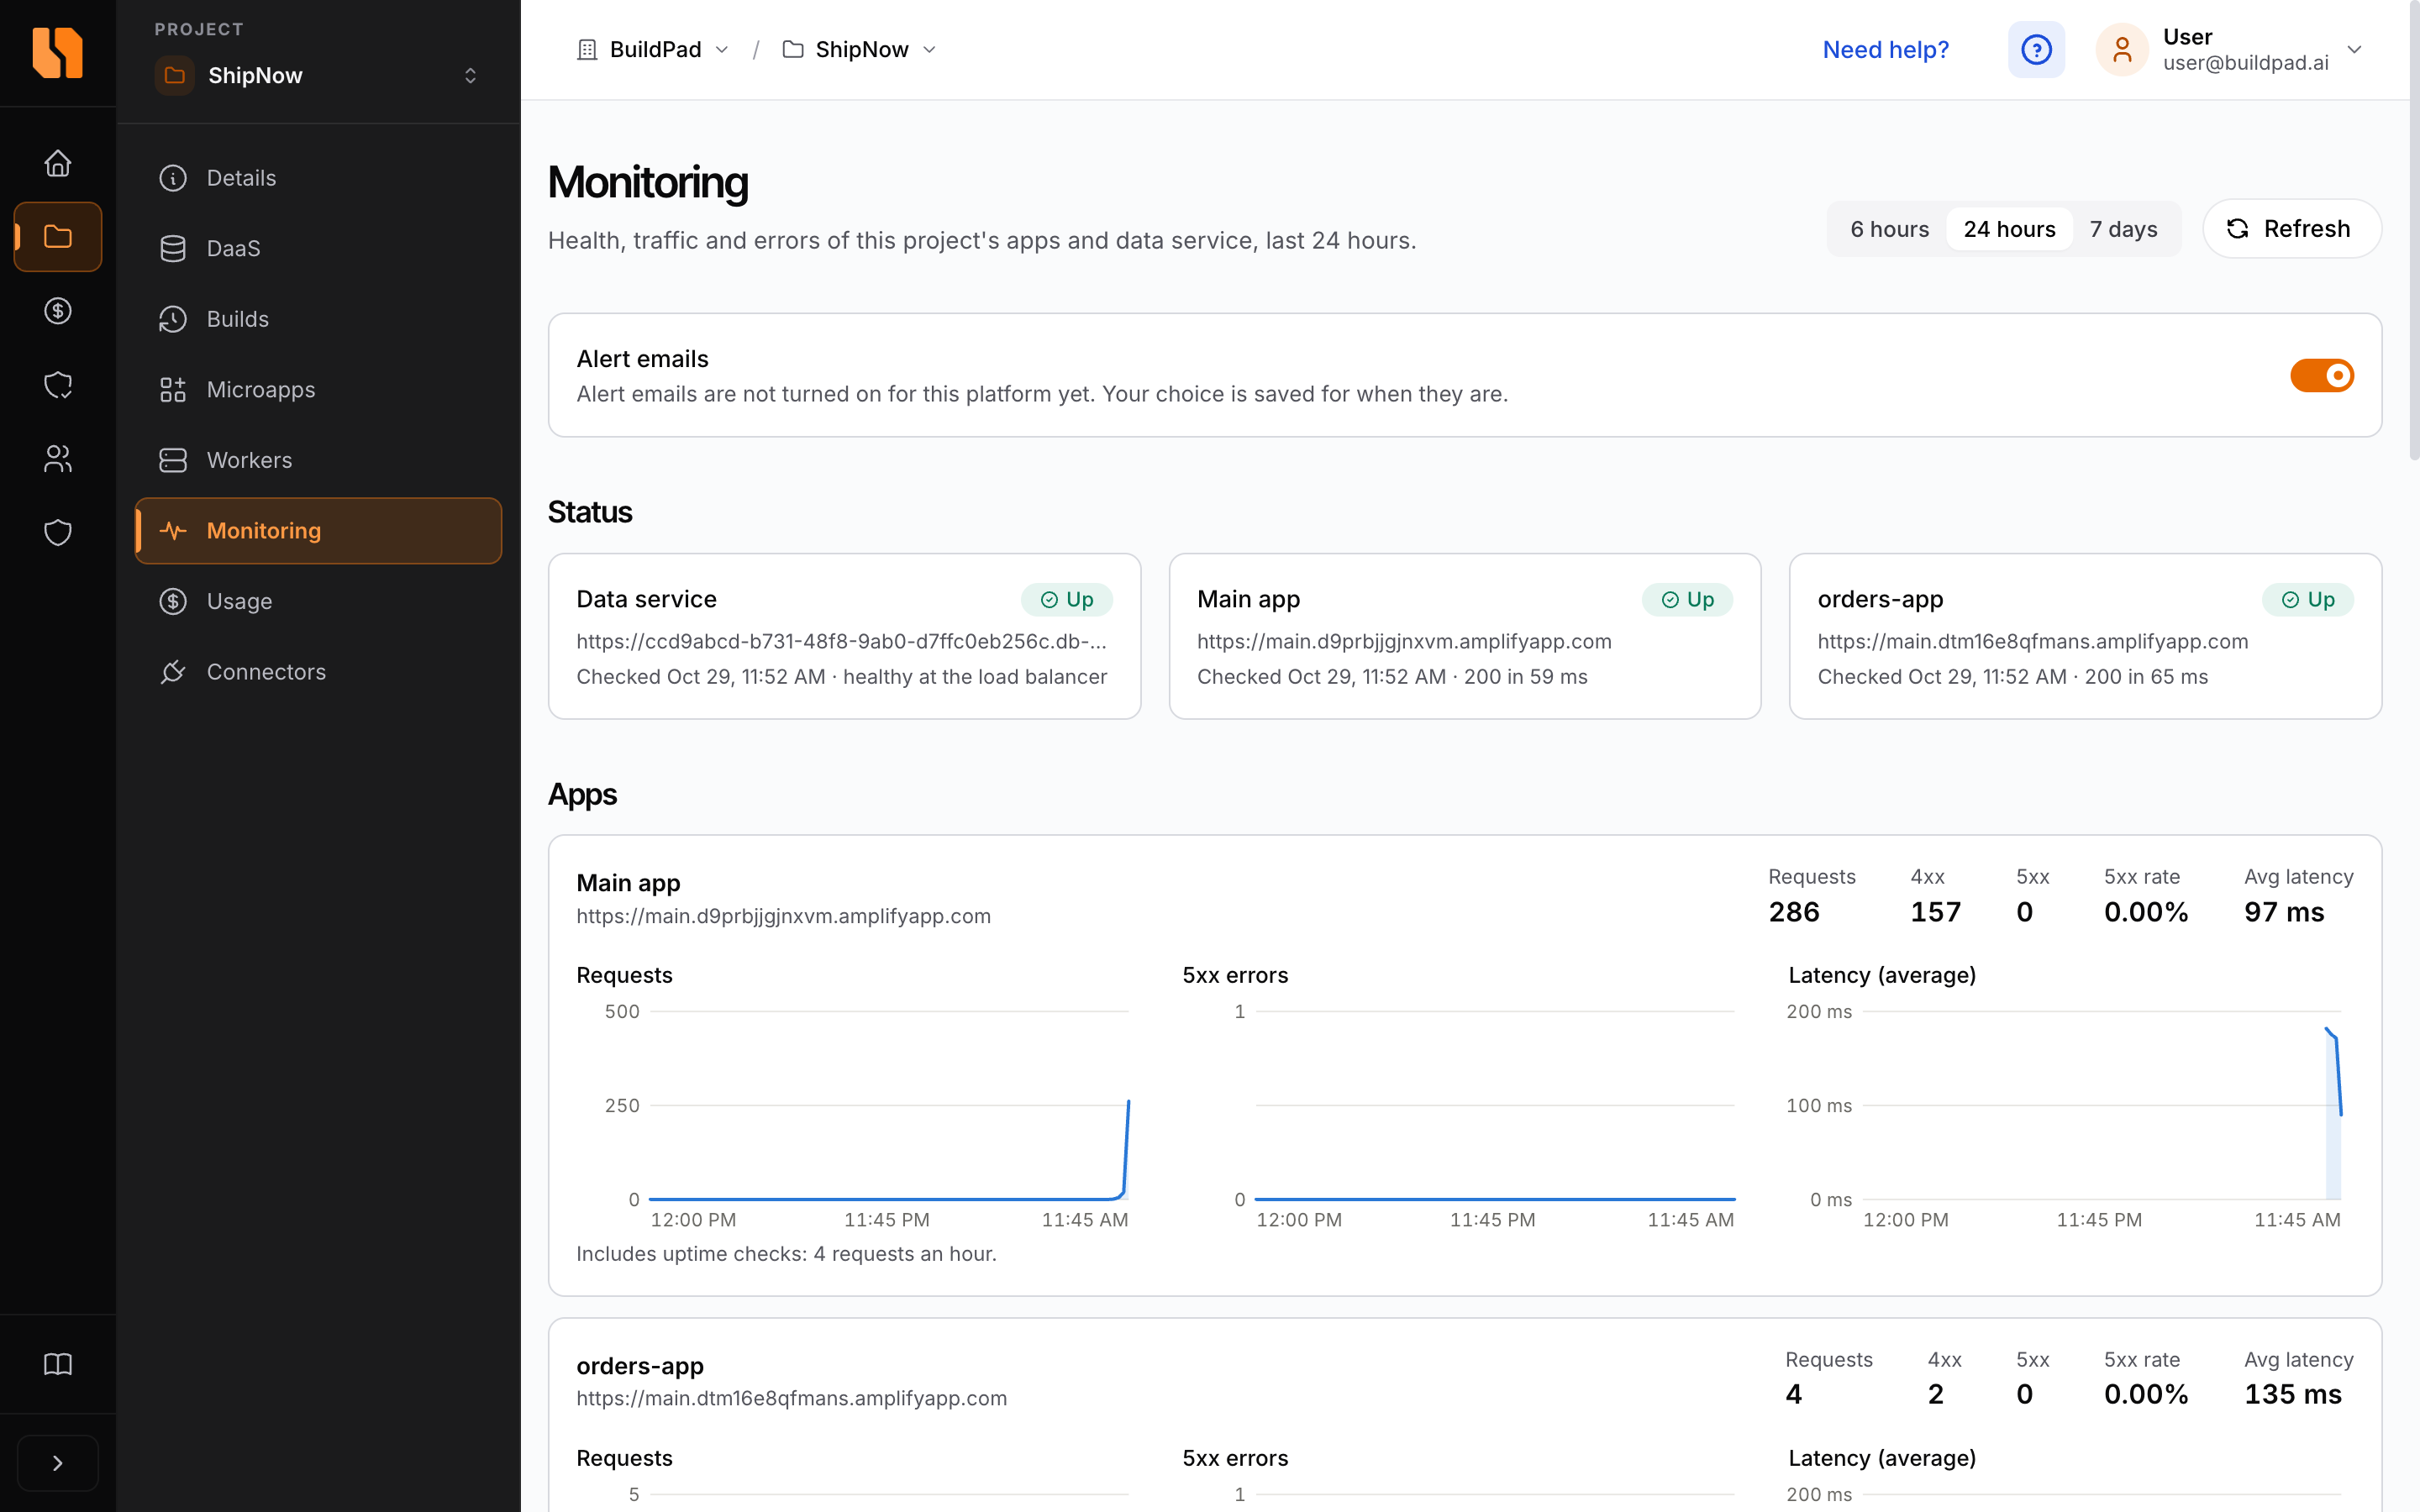
Status
The Status section has one card for each target: the Data service, the Main app, and each microapp. A mobile microapp shows as <name> (API), because its hosted app is the API of the mobile app.
Each card shows the address of the target, the result of the last check, and its state:
| State | Meaning |
|---|---|
| Up | The last check passed. |
| Failing | The last check failed. One more failed check opens a Down incident. |
| Down | A Down incident is open for the target. |
| High error rate | A High error rate incident is open for the app. |
| Paused | The project is stopped, so the checks are paused. |
| Not checked yet | The target has no check result yet. |
When the project is stopped, the section shows The project is stopped, so uptime checks are paused. They resume when the project is started. If incidents are open, a red badge shows the number of open incidents.
Apps
The Apps section has one card for each hosted app. Each card shows these values for the time range:
- Requests, 4xx, 5xx and 5xx rate
- Avg latency, the average response time
- Charts of the requests, the 5xx errors and the average latency
The request count includes the uptime checks, 4 requests an hour for each app.
Servers
The Servers section has one card for each server of the project: the Data service host, and the Worker server if the project has workers. Each card shows:
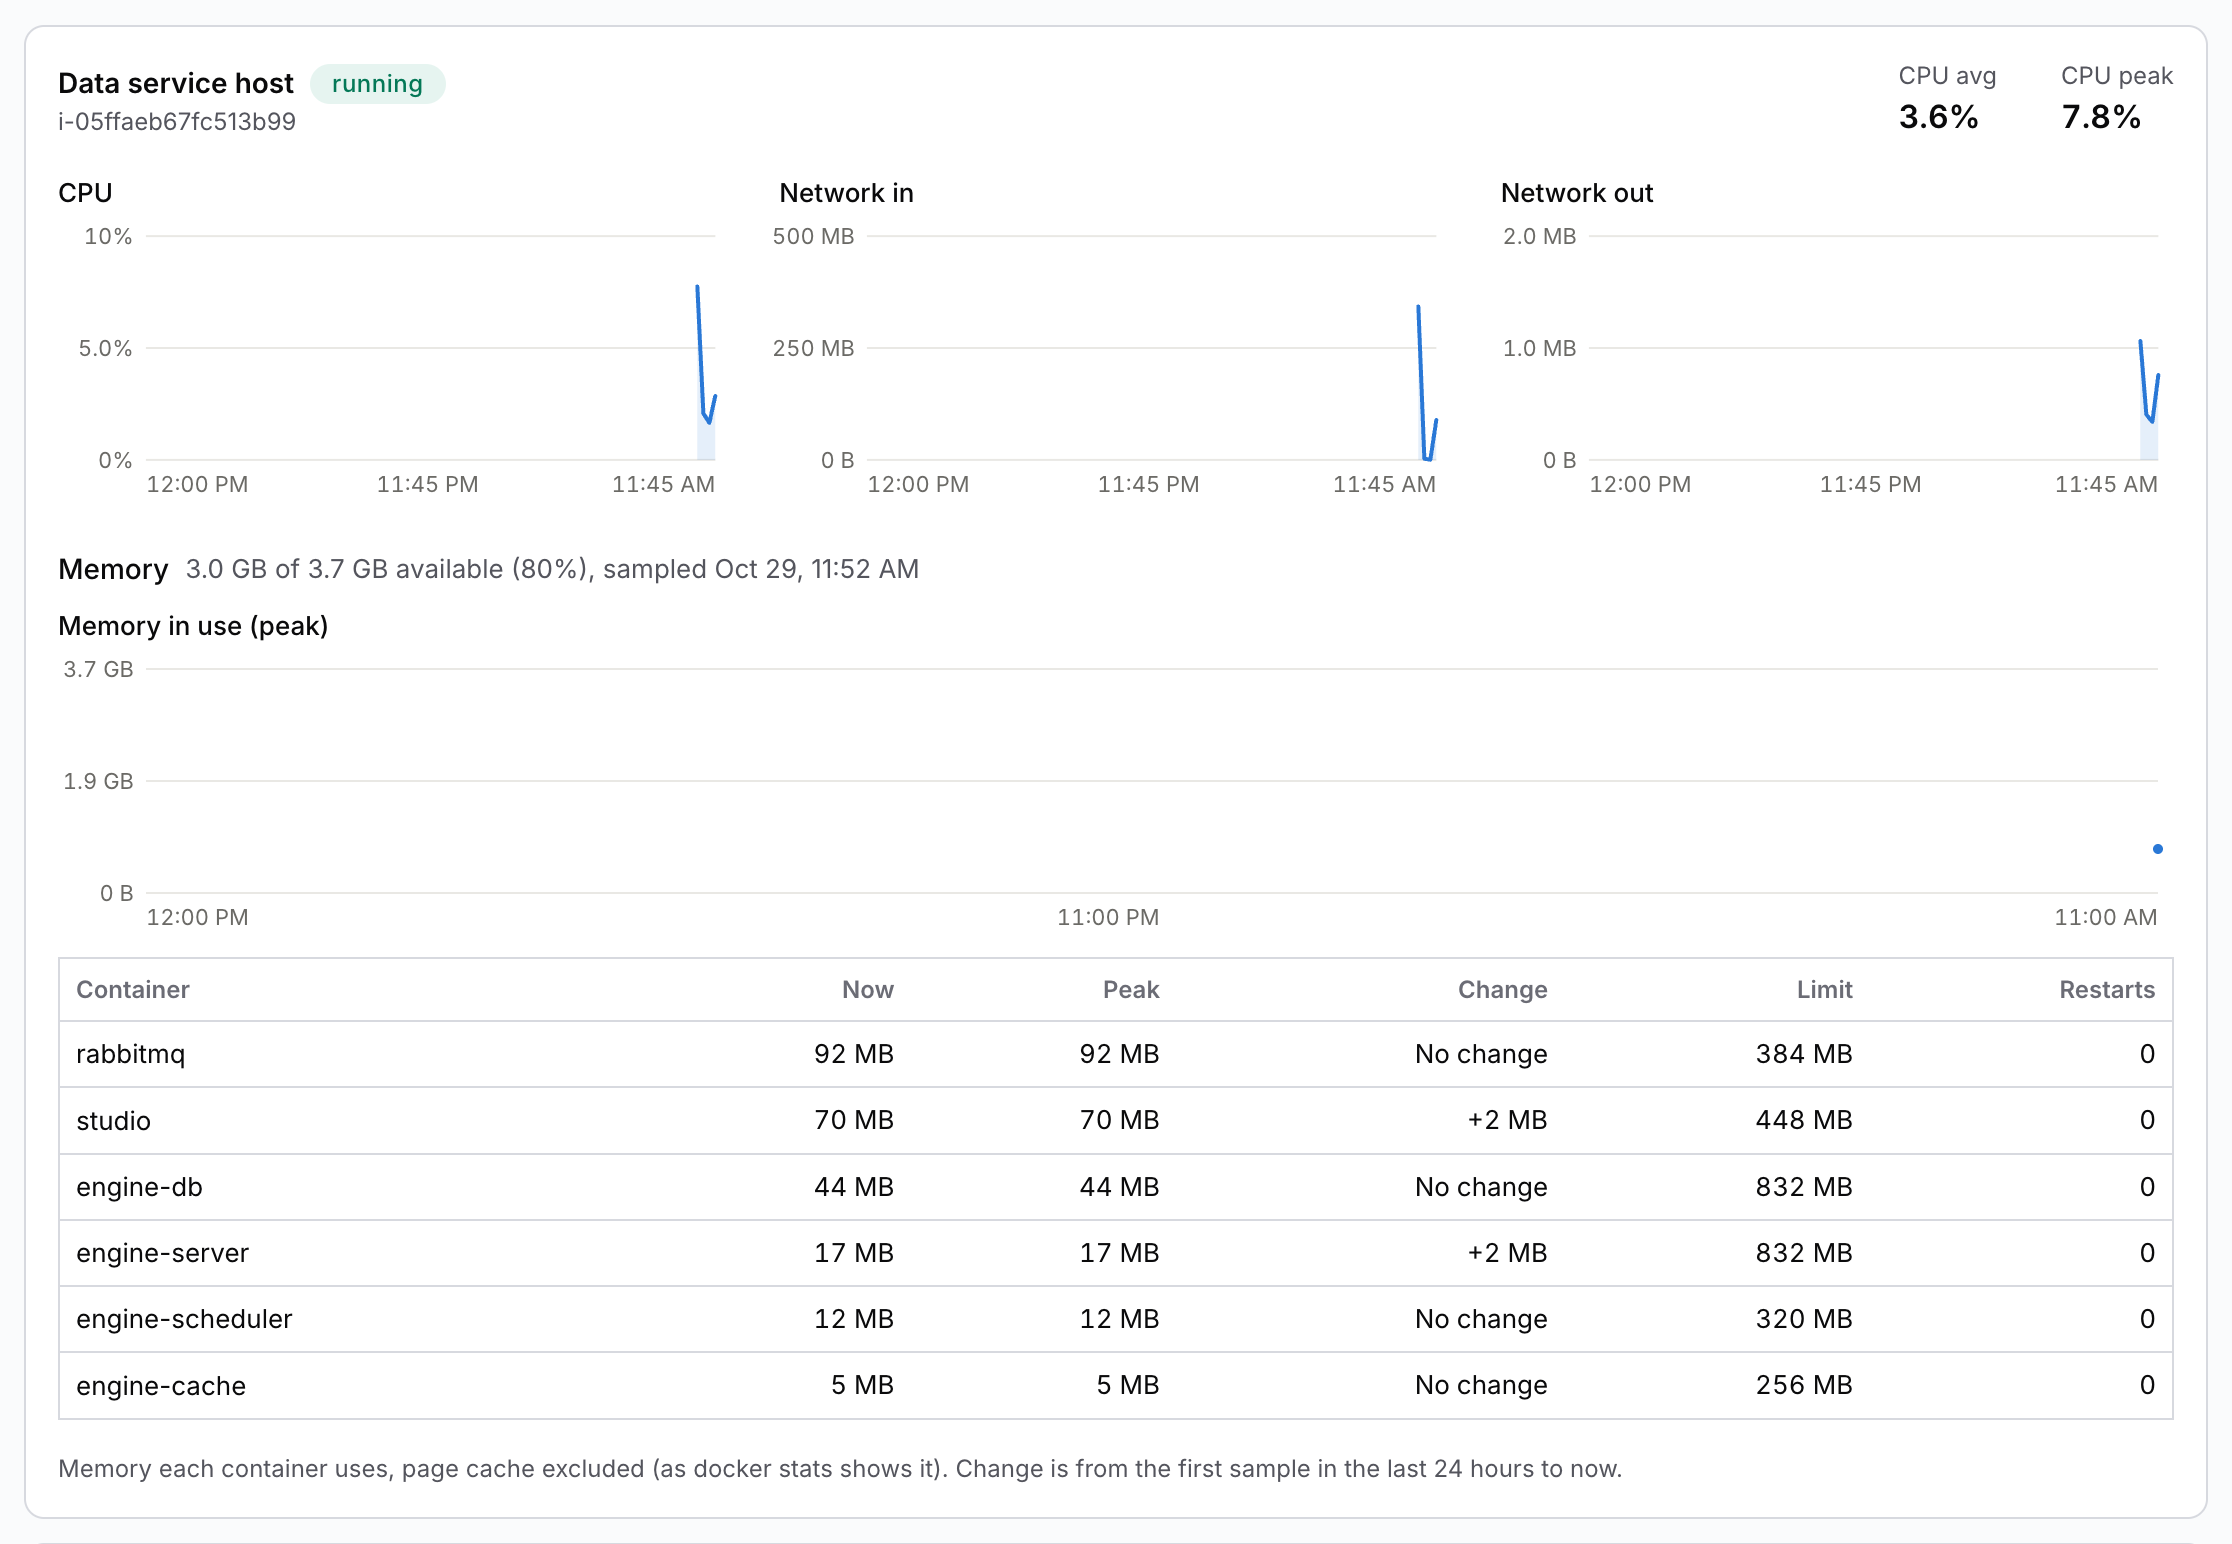
- The state of the server, for example
runningorstopped - Status check failed, if the AWS status check of the server failed
- CPU avg and CPU peak
- Charts of the CPU, Network in and Network out
- A Memory panel. See Memory.
The page does not show disk use.
Memory
The Memory panel shows how much memory the server has available, for example 1.2 GB of 3.8 GB available (31%), and when the platform took the last sample. If less than 10% is available, a red Low on memory badge shows.
The panel has these charts:
- Memory in use (peak): the top of the chart is the total memory of the server.
- Swap in use (peak): shown only when the server has swap.
Each point of a chart is the highest sample in its period: 15 minutes for 6 hours, 1 hour for 24 hours, and 3 hours for 7 days.
The table under the charts shows each container on the server:
| Column | Meaning |
|---|---|
| Container | The name of the container. Growing shows when the container grew by 100 MB or more and by 20% or more in the time range. Out of memory shows when the system stopped the container because it ran out of memory. |
| Now | The memory that the container uses in the last sample, not including the page cache (as docker stats shows it). |
| Peak | The highest use in the time range. |
| Change | The change from the first sample in the time range to now. No change means less than 1 MB either way. |
| Limit | The memory limit of the container. None means that the container has no limit. |
| Restarts | How many times the container restarted. |
If a container is growing, a line under the charts names it. A container that grows steadily, and goes back down when it restarts, usually has a memory leak.
The platform takes a memory sample every 15 minutes from each running server, through AWS Systems Manager. A worker server is sampled only while the data service host runs. If a sample fails, the chart has a gap. If the server has no samples in the time range, for example because it is stopped, the panel shows No memory samples yet. They are taken every 15 minutes while the project is running.
Uptime
The Uptime section shows one strip for each target. Each cell of a strip is one period of time:
| Range | One cell |
|---|---|
| 6 hours | 30 minutes |
| 24 hours | 1 hour |
| 7 days | 6 hours |
Put the pointer on a cell to see its time and its result. A cell has one of these results: All checks up, Some checks failed, All checks failed or Not checked.
Incidents
The Incidents table shows each incident in the time range: the Target, What happened, when it Started, its Duration, and its State (Open or Resolved). Put the pointer on Resolved to see how the incident was resolved.
Recent Errors
The Recent errors table shows the newest 100 error lines from the server logs of the apps and from the logs of the workers. Each line shows the Time, the Source and the Message.
If the platform cannot read the logs of a source, a yellow box shows <source>: logs unavailable with the reason. The other sources still show their errors.
How the Checks Work
The platform checks every running project every 15 minutes.
- An app gets one HTTP request. Any response below 500 means that the app is up. A redirect or a 404 on the root of the app is up. A 5xx response, a timeout after 10 seconds, or a network error means that the app is down.
- The data service is not called over HTTP. The platform reads the target health of the data service at its load balancer. Thus, the checks do not count as use of the project, and do not stop the project from becoming idle.
In the same pass, the platform takes a memory sample of each running server.
A stopped project is not checked. When you stop a project, its open incidents close as paused.
After a move to the Buildpad Engine, the checks watch the Engine. The old data service host that the move stops does not show in Servers, and does not make the page show the project as stopped.
Incidents
The platform opens an incident for one of three causes:
| Cause | Opens when | Resolves when |
|---|---|---|
| Down | Two checks in a row fail. One failed check does not open an incident. | The first check passes. |
| High error rate | 5% or more of the requests to an app in 15 minutes get a 5xx response. The app must have 20 or more requests in that time. | The error rate goes below 2.5%, or the app has fewer than 20 requests in 15 minutes. |
| Low on memory | Less than 10% of the memory of a server is available in two samples in a row. | 20% or more of the memory is available. |
A Low on memory incident is for the Data service host or the Worker server. Its details name the three containers that use the most memory. The Status cards do not show it, but the count of open incidents includes it.
The platform keeps the check results, the memory samples and the incidents for 14 days.
Messages
| Message | Cause | What to do |
|---|---|---|
| This project has no deployed apps or data service yet. | The project has no hosted app and no data service address. | Deploy the main app or a microapp, or wait until the data service is ready. |
| Metrics unavailable | The platform cannot read the metrics from AWS. | The status and the errors still show. Click Refresh later. |
| Could not load monitoring | The page did not get its data. | Click Refresh. If the message continues, see Troubleshooting. |